2025 Annual Productivity Review: Uncover Your Year in Numbers

December has a way of making you wonder where the year has gone. You remember being busy, but what did you actually achieve? You know you worked on things, but what patterns emerged? Sometimes you felt productive and other times scattered, but what does the bigger picture look like?
Timestripe's New Year Summary feature provides an annual productivity review to help you answer these questions.
Introducing Your Annual Productivity Review
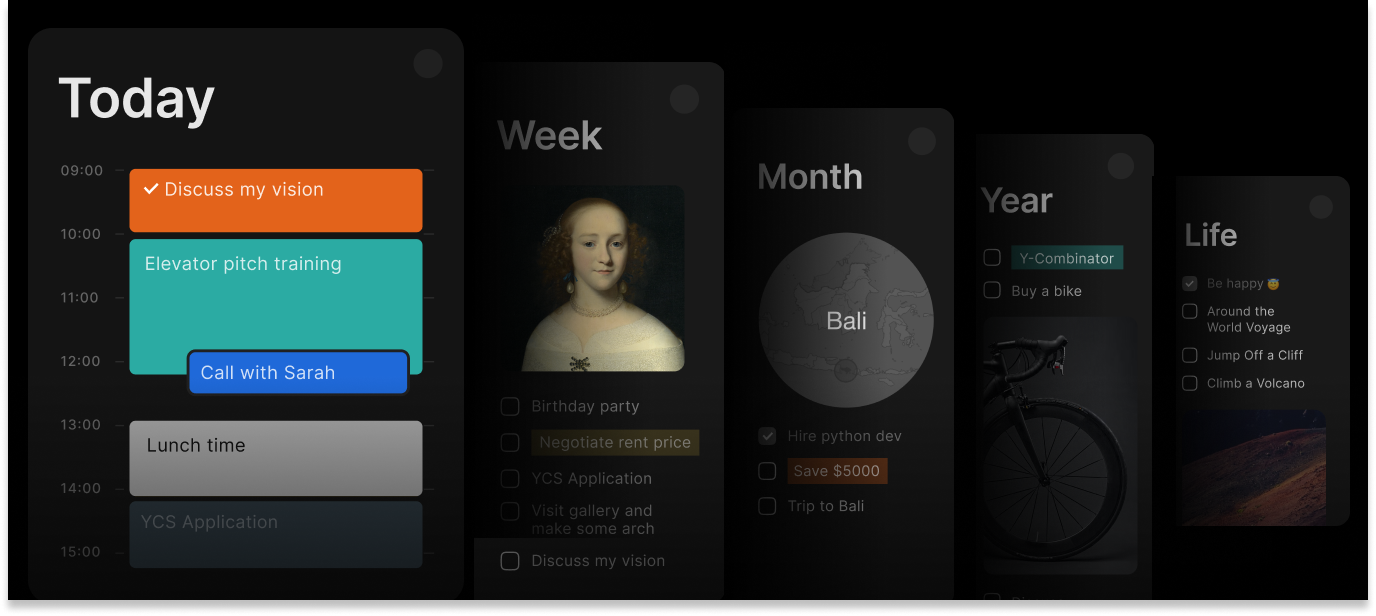
Your 2025 is visualized in Timestripe, turning twelve months of work into clear insights about how you actually spend your time and energy. Think of it as holding up a map to your year, seeing work patterns you sensed but couldn’t quite articulate.
Here’s what becomes visible in your productivity dashboard:
Goals reached
The actual number of things you completed this year, whether that’s dozens or thousands. Both tell meaningful stories about different approaches to work. Goal tracking shows it clearly rather than relying on fuzzy memory about “what you got done.”
Longest streak
How many consecutive productive days you maintained? Some streaks stretch across months. Others are shorter but just as significant. Each one reveals something about when your systems were working well and when they needed adjusting. Understanding your natural rhythm of consistency enables you to work with it rather than constantly fighting against it.
Productive days percentage
The share of days where you made tangible progress on what mattered. For highly effective users, this productivity metric often hovers in the high seventies. This means even the most consistent people are genuinely productive about four days out of every five, which helps set realistic expectations about what sustainable productivity actually looks like.
Goals created
The total number of things you set out to accomplish. This number often surprises people because we tend to underestimate our actual workload. Seeing the full scope helps explain why you felt busy even when individual projects didn’t feel overwhelming.
Most active month
When you were really in flow? Sometimes it aligns with what you remember. Sometimes it’s completely unexpected, revealing work patterns you didn’t consciously notice. Knowing when you naturally work best helps you plan around your energy patterns rather than fighting them.
Active days
How many days you engaged with your work in Timestripe? Consistent users often reach most days of the year, showing that sustainable productivity is about showing up regularly, even when it’s imperfect. This productivity tracking metric captures persistence rather than perfection.
Completion rate
The percentage of goals you finished versus those you started. Strong performers often complete somewhere in the mid-to-high range. This isn’t failure when things don’t finish. On the contrary, it’s a good decision-making process. Some goals become irrelevant. Some are worth starting but not finishing. Some teach you what you need to know before you reach the end. This metric shows that you are making decisions, not just accumulating tasks.
Productivity growth
How do your patterns in 2025 compare to those in 2024 if you used Timestripe in both years? This performance insight reveals whether your systems are evolving in helpful directions or whether adjustments might be needed. Growth isn’t always linear, and that’s fine. The point is understanding the trajectory.
Your top tags
The themes that dominated your year. Your tags reveal what actually consumed your attention, as opposed to what you thought you were focusing on. Sometimes these align perfectly, sometimes the gap is illuminating.
Monthly visualization
A bar chart showing your activity across twelve months. The patterns tell stories without needing interpretation. Consistent bars suggest steady rhythms. Spikes indicate intense periods. Dips show breaks or struggles. No judgment imposed, just your year made visible.
Timestripe is a smart, well-designed workspace for all your projects, tasks and notes.
Try it today
Get StartedWhy Year-End Reflection Matters
Looking back at your year through productivity analytics creates a different kind of clarity than memory alone provides. Memory is selective and often unreliable. You remember the dramatic moments and forget the steady work. You recall feeling busy, but not necessarily what made you busy or whether that busyness led anywhere meaningful.
The Year Summary fills in those gaps. When you see thousands of completed goals, try to understand the scope of what you actually moved forward. When you notice your longest streak occurred during specific months, you can think back to what systems or circumstances made that possible. When one month emerges as your most active, you have a data point about your natural energy cycles.
This kind of year-end reflection serves a practical purpose beyond nostalgia or self-assessment. It helps you understand your actual work habits so you can work with them instead of against them. If your productivity tends to dip during certain months, consider taking on lighter commitments rather than fighting your natural rhythm. If you tend to finish most of what you start, perhaps you should be more selective about what you choose to finish, rather than forcing completion for completion’s sake.
These productivity insights create context for better decisions about how to approach the next year. They show you what worked, what didn’t, and what patterns emerged that you might not have noticed day-to-day.
Let the Numbers Speak
Let’s be clear about the limits of productivity metrics.
These numbers can’t tell you whether your work was meaningful, whether you were happy, or whether you made choices aligned with your values. They measure activity and completion, not significance or satisfaction. A thousand completed goals could mean remarkable progress towards your most important goals, or they could mean that you have been busy avoiding the things that actually need your attention.
What they can show you is whether you showed up, whether you followed through, and whether your systems supported or hindered your intentions. Performance analytics reveal patterns relating to your consistency, focus, and ability to complete tasks. They make visible the gap between what you intended and what actually happened, which is useful information even if it’s sometimes uncomfortable.
Highly productive days still include imperfection, inconsistency, and incomplete projects. Strong completion rates still mean not finishing plenty of what you start. Active days still include struggles, distractions, and moments where nothing seemed to work. The numbers help you see what “normal” actually looks like for someone making consistent progress, complete with all the mess that entails.
These productivity metrics help you identify patterns, but they don’t define your worth. They are simply measurements of specific things during a particular year.
Using This Information
What you do with your annual review depends entirely on what patterns you notice and what questions they raise.
Perhaps you will see a long streak and remember what made that period work so well, providing you with something concrete to refer back to. Or you will remember a project structure worth replicating from one month’s peak activity. Perhaps your completion rate will prompt you to be more selective about the goals you set for yourself. Perhaps seeing certain tags dominate your year confirms what you suspected about where your attention went, or reveals something you weren’t consciously aware of.
Or maybe you look at it, find it interesting, and move on. That’s completely valid too. The summary exists to provide clarity about what actually happened in your year. What you do with that clarity depends on what feels useful or necessary for you.
Beyond the Annual Review
Year Summary launches with your 2025 data and will continue automatically. Next December, you’ll see your 2026 work patterns. The year after, 2027. Over time, these summaries create a longer view of how your productivity evolves, showing which years you maintained consistency, which periods you locked in intensely, and which systems proved sustainable versus which burned out.
This longer perspective helps you make increasingly informed decisions about where to focus your limited time and energy. You start noticing what actually works for you over time, not just what feels productive in the moment or sounds good in theory.
Read next

Check your Year Summary
Your 2025 recap is ready in Timestripe. See what you actually accomplished, discover your productivity patterns, and understand how you really work.
Get Started